How to properly match confirmed bars across timeframes to create a non-repainting indicator

4 minute read
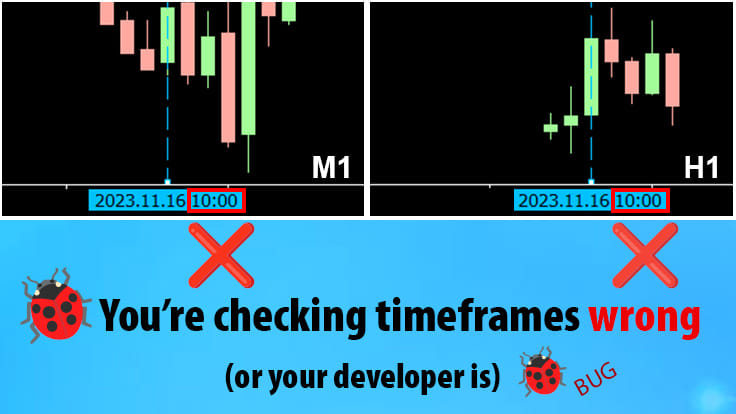
When creating an indicator that checks rules across different timeframes, too many developers and traders alike get this wrong: If you want to check a rule in both M1 and H1 at bar 10:00, you put a vertical line on bar 10:00 then flip between the M1 and H1 charts to check – this is wrong!
And, if your developer is doing it this way in code, it’s also a bug. They’ll create a repainting indicator, where the historical arrows are fake and don’t reflect where the indicator puts arrows in real-time. This’ll make the indicator’s historical arrows deceptive and unfortunately useless for historical analysis and strategy improvement.
How to check for a multi-timeframe indicator that does it wrong
You can check if an indicator repaints by running it through the Strategy Tester. Wait till the test run ends, watching how it draws its arrows in real time moving forward. Then, at the end of the test run, drag another instance of the same indicator from the MT4 Navigator pane onto the finished Tester chart. This will overlay arrows that are calculated using the indicator’s history calculation method, rather than real-time method.
If all’s correct, the loaded arrow positions should match the real-time arrow positions – if so, congratulations, the indicator is non-repainting and the developer did it right!
If the loaded arrows mismatch, then there’s an error in the indicator. And all too often, it’s because the developer didn’t compare timeframe bars correctly, which is the cause of many repainting multi-timeframe indicators with a false history out there on the market.
The mistake lies in how bars are compared across timeframes – both traders and developers often misunderstand (or forget) how to do this. For example, to check a rule at bar 10:00 in both M1 and H1, you might place a vertical line on bar 10:00, then flip between M1 and H1 charts to check – this is wrong.
How to compare bars across timeframes
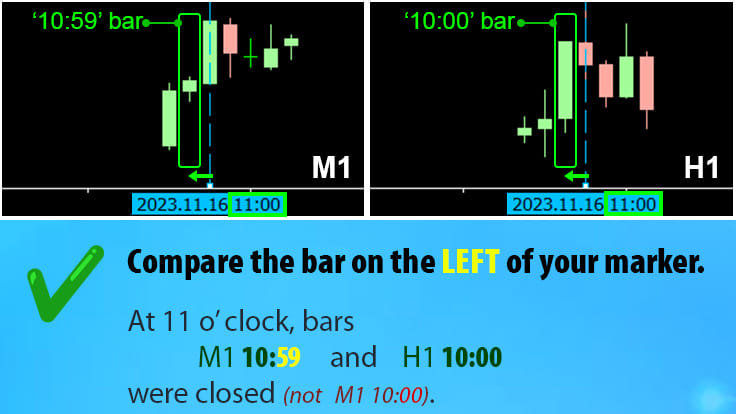
To check a rule at a certain bar across different timeframe charts, place a vertical line on the bar after the one concerned. Then you should refer to the closed bar just to the left of your line.

Here’s an example: You want to analyze bar 10:00 in H1, and check M1 as well at the time that this bar closed. So, place a vertical line at 11:00 in H1 (the bar after the one concerned). Your vertical line marks the real time that the 10:00 bar closed, which was at 11 o’ clock. Now think carefully: In real life, at 11 o’ clock, what was the state of the M1 chart? The answer is: the M1 bar 10:59 had just closed. Now flip to the M1 chart and look just to the left of your vertical line – you’ll correctly see it’s the 10:59 bar. This is the correct way to check state across timeframes, matching real time behavior.
So, again, the way to think is: “I want to compare the state of charts across timeframes at real time 11:00”. The correct closed bars to look at are…
- M1 10:59
- M5 10:55
- M15 10:45
- M30 10:30
- H1 10:00
- H4 08:00
…bars, which are the bars that are closed at 11 o’ clock.
Testing correctness: By alert time
If you’re a trader or producer checking if an indicator has been made right, or a developer in testing phase, you should mainly test for correctness using the method under ‘How to check for a multi-timeframe indicator that does it wrong’ at the beginning of this article. In addition, here’s another quick check:-
Let’s say an indicator is supposed to have a Timeframe input, and if you select H1, it’s supposed to calculate signals based on closed H1 candles, even if you run the indicator on M1. Let’s say you’ve asked for a popup alert to be implemented.
Now, if the indicator alerts the trader at the real time of 11 o’ clock when running on the H1 chart, then even if the indicator runs instead on M1, it should still alert the trader at the real time of 11 o’ clock.
Verify this in the Tester by running the indicator in M1, M5, M15, M30 and H1 modes. Then, in the Journal, look for ‘alert’ logs. The alerts should always arrive at the same Journal chart time (see pic below). This proves that the indicator gives you the same advice at the same time, even if it’s run on a lower timeframe.

Summary
If you’re a trader, place a vertical line on the bar after the one concerned. Now, you can flip between timeframes, always looking at the bar just to the left of the line, which is the bar that would have been the most recent closed bar.
If you’re a developer, you need to do the same in code, matching up historical closed bars properly based on how charts really play out in real time. Otherwise, you’ll produce a repainting indicator with ‘lying’ history arrows.
To check for repainting or ‘lying’ indicator arrows, or uncover multi-timeframe calculation errors, or to double-check your correct development, use the Tester as explained this article.
Most importantly, remember that putting a line on bar 10:00 and checking this same bar on M1 and H1 is wrong, because the M1 10:00 bar closed at 10:01, and the H1 10:00 bar closed at 11:00 – these events are almost one hour apart. They aren’t the correct closed candles to match in history. If you can’t figure out the correct ones to match in history, be sure to re-read the whole article!
Good luck!
P.s. Sometimes, a correctly made multi-timeframe indicator might still act slightly differently if run on different timeframes. A lot of the time, the reason is because of mismatched candle data. For example, M1 data may show the week starting at 00:00, yet H4 may show the week starting at 00:10, which is a data error. This may cause the indicator to be unable to find matching candles or fall into data gaps. Data errors should be fixed by getting clean data, which is a different topic. Diagnosing this situation is a story for another time – meanwhile, to reduce headache, hire a professional!